Step 1
Share your product
Paste a live URL, or share a demo login, a Figma file or a screen recording. Credentials are encrypted and deleted after analysis.
Audit
Encrypted, deleted after the audit
Executive UX + AI & search visibilityExecutive UX audit + AI & search visibility (SEO & GEO)
A senior-level UX and UI audit of your website, app or dashboard, plus an AI and search visibility check for Google, ChatGPT, Claude and Perplexity. Every issue is pinned on screen, with a clear plan of what to fix first.
First scan free · No credit card · See a sample report
Auditing a signed-in app or dashboard? Use a demo login or a Figma file
3
4
5
Headline describes a category, not an outcome
Visitors cannot tell what changes for them. This suppresses signup conversion on every paid and organic visit.
Fix: lead with the outcome and buyer in under ten words.
Two audits in one
A senior-level review of the experience, plus a check of how search engines and AI assistants find, read and recommend you.
What a senior product designer would flag on your website, landing page, app or web system, written for founders and executives.
SEO and GEO best practices, checked on your live pages, with the exact changes that get you found and cited.
SEO · search engines
GEO · AI answer engines
52%
AI & search health
One audit, measured
Every audit ends in a score, a count of what is broken and how quickly you can fix it. These are the results of the Acme Insights sample audit.
Growth Readiness
0/100
Six weighted sub-scores
Issues found
0
Screens annotated
0
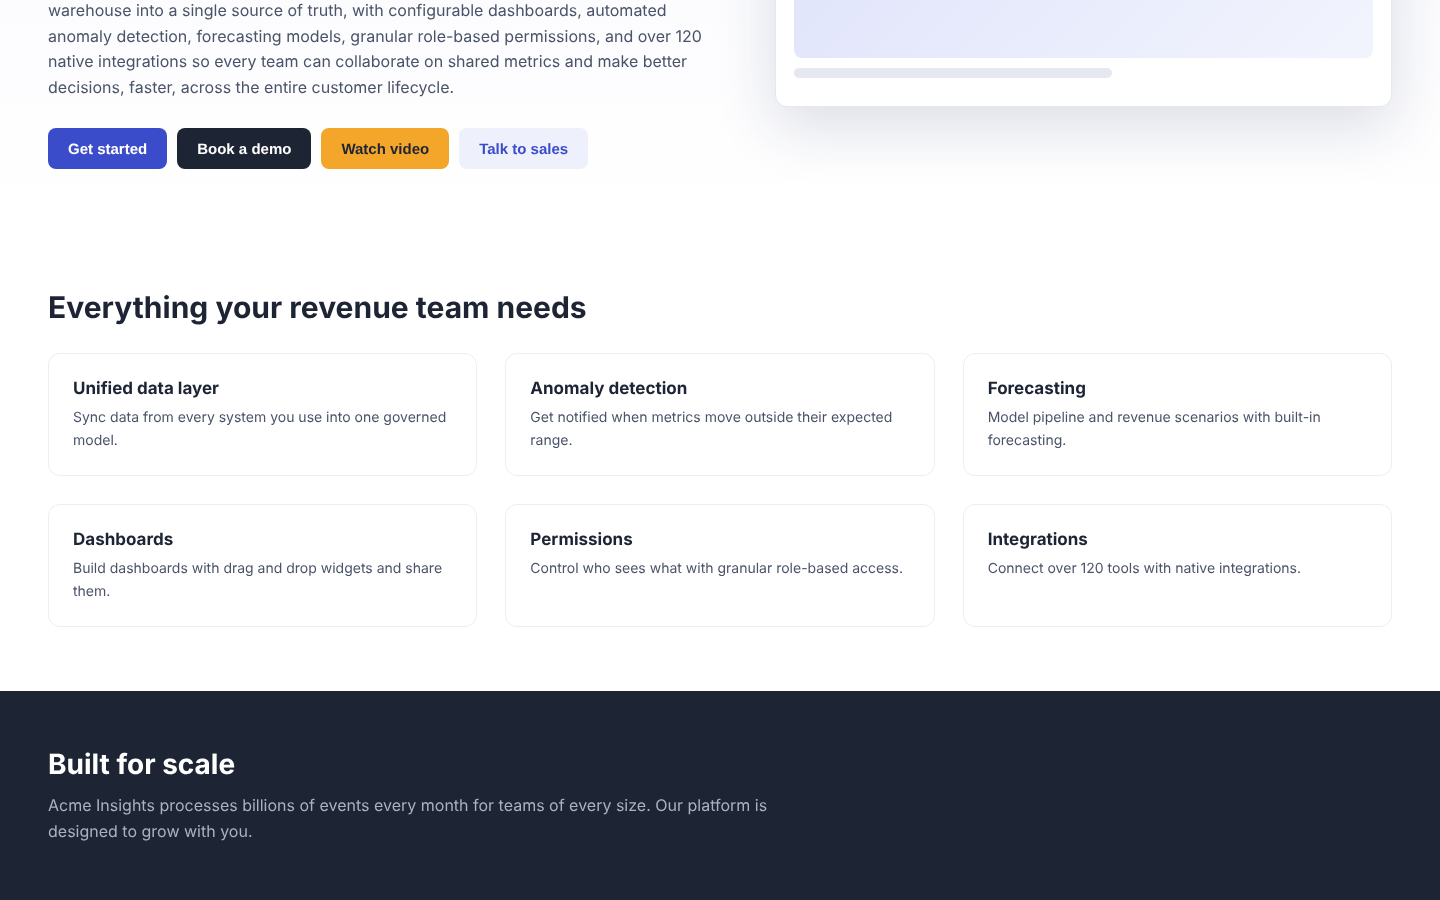
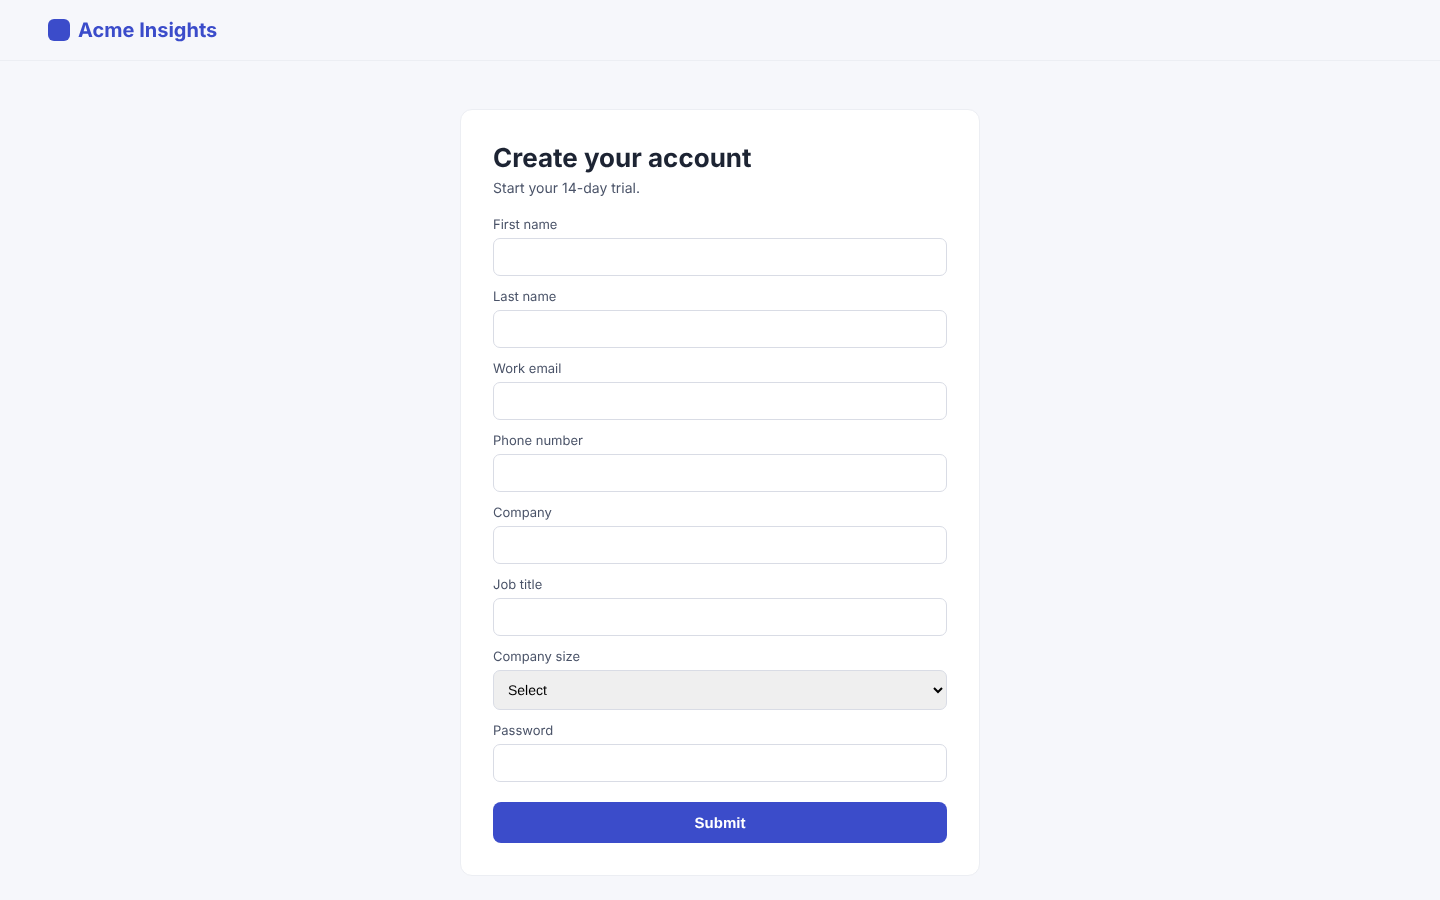
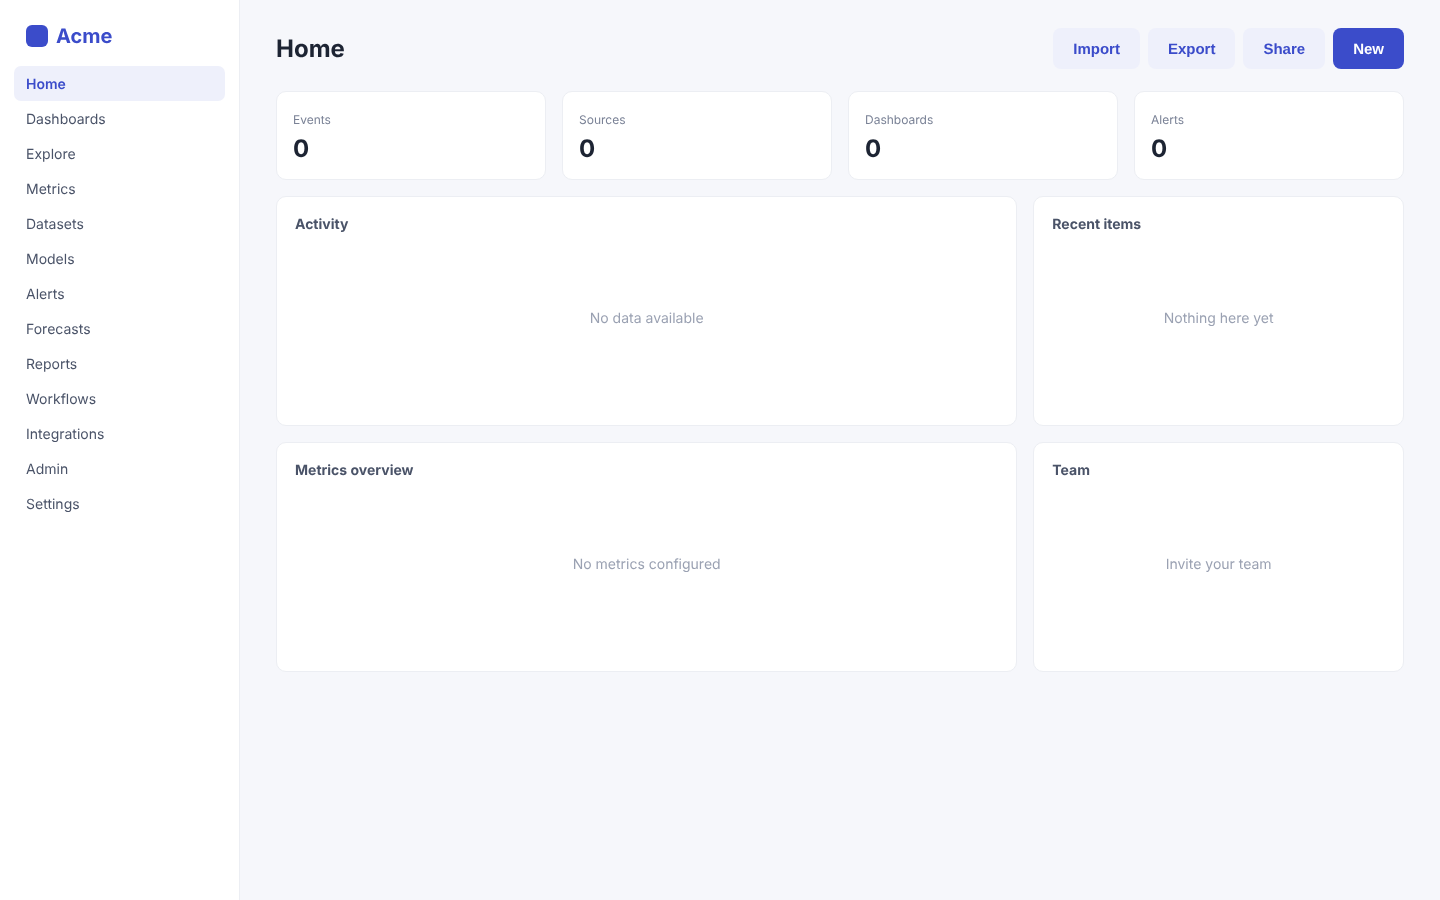
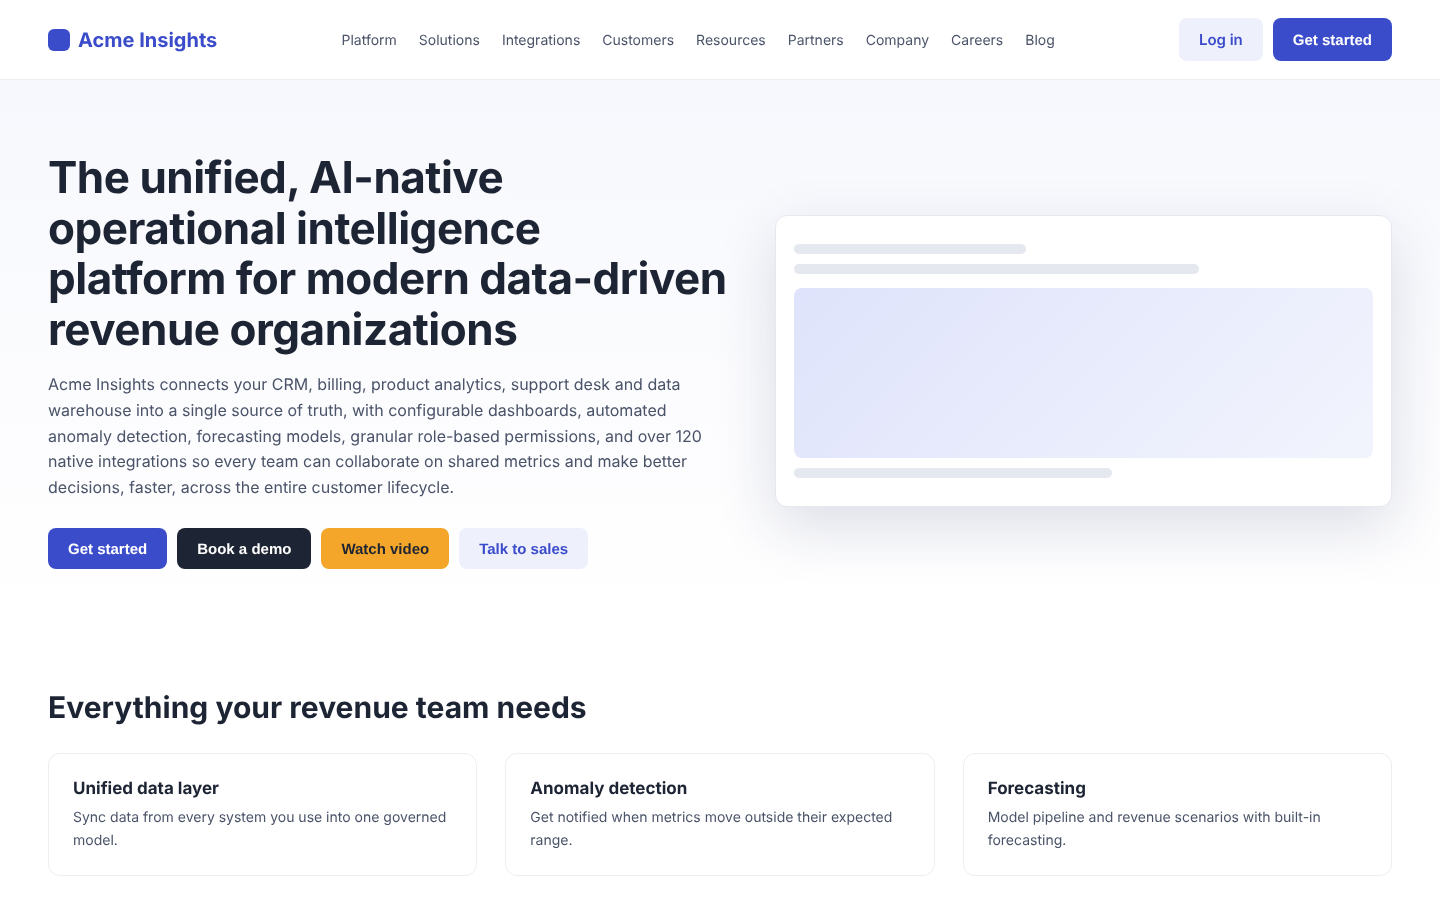
Website, sign-up, dashboard and mobile
Quick wins
0/12
Findings that are low effort to fix
Beyond landing pages
The same scoring and annotated findings work on public pages, signed-in product screens, complex dashboards and designs that have not shipped yet.
Paste a URL. We capture desktop and mobile, plus key pages like pricing and sign-up.
Scan a URLShare a demo login. We sign in, walk the signed-in screens and audit onboarding and core workflows. Credentials are deleted right after.
Audit with a demo loginConnect a Figma file or upload screenshots and recordings to audit work before it ships.
Audit a Figma fileProof, not opinions
Stats from the sample audit, each shown on the screen it was measured on. Your report pins every finding the same way.
0 words
in the headline, none of them an outcome
0 CTAs
competing for attention in the hero
0 next steps
on the first in-app screen after sign-up
0 fields
required before the user sees any value
0 nav items
at equal weight inside the product
0 proof points
no logos, testimonials or numbers
Scores and benchmarks
Each criterion is scored from 0 to 100 and compared with strong SaaS products, so the biggest gaps are obvious at a glance.
Benchmark values are illustrative. Hover or focus a row for the gap.
−0 pts
behind the top quartile. Fixing the three critical issues closes most of the gap.
How it works
Three steps, about two minutes. Hover or tap a step to try it.
Paste a live URL, or share a demo login, a Figma file or a screen recording. Credentials are encrypted and deleted after analysis.
Encrypted, deleted after the audit
Each screen is reviewed like a senior UX lead would, while your pages are crawled for SEO and GEO: indexing, AI crawler access and structured data.
Get your Growth Readiness Score, issues pinned on screen and a plan ranked by impact. Tick a fix below to see the score climb.
Growth Readiness
48/100
+0 pts
Each pillar weighs six criteria by their effect on acquisition, activation and revenue. Together they make your overall audit score.
Start with a free scan. Go Pro for the full report and unlimited scans.
$0one scan
Your first product scan, free. A preview of what is blocking growth.
$39per month
Unlimited scans with the full executive report.
Need a senior strategist? Executive human audits by Matan.Design are available from every report.
Your first audit is free and takes about two minutes.
or view a sample report first